Have you ever wondered if there was a way to gauge and chart your user’s behaviors while they’re on your WordPress website? Well, if you have, then it’s time to check out heat-mapping, programs that help you gain insights into user interactions such as where on your site they click, what specific areas they explore more than others and generally how they use your site for their purposes.
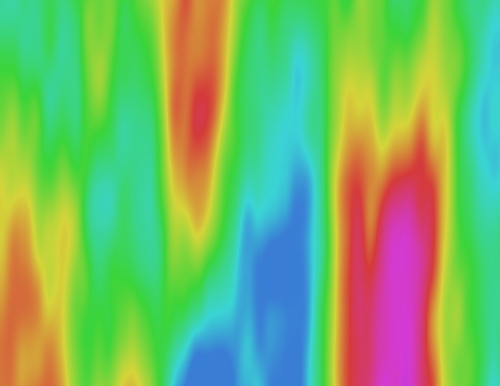
Essentially, the tools and programs for creating a heat-map build an “overlay” of your various site’s pages, and areas that attract more activity appear “hotter” than sections that experience low activity. And all this wonderful information is provided to the site owner or administrator in the form of visual analytics that makes it easy to digest and, ultimately, leverage the knowledge gained. Indeed, armed with this information someone can gain valuable insights into usability issues that can then govern what changes one makes to the site to best optimize the visitor experience.
Fortunately for WordPress users there are some fantastic plugins and other tools that make creating a heatmap an absolute snap. Here are a handful worth investigating and implementing.
- One of the most popular available currently is Crazy Egg, a tool that allows users to create heatmaps that chart very specific elements of user interaction. For instance, a site owner can view a map that shows what people are clicking on (i.e. images, links, posts); how their mouse is traveling across the various pages: and even how far they’re scrolling down a particular page. There’s even a map that divides data into “traffic sources,” meaning you can determine how users from various parts of the Web—search engines, social networks etc.—access and use a site. The program is available as a plugin with a very easy installation process and their plans start at around nine bucks a month (there’s even a free one-month trial for those who just want to check out the basic version.)
- Lucky Orange comes in at about the same price as Crazy Egg, and offers heatmaps for tracking movement around a site, clicks and how far users scroll down on a specific page. It also has session recording for extremely detailed information gathering and comes equipped with forms showing all sorts of more traditional analytics plus charts for conversions (important if yours is an e-commerce site looking to determine what exactly is attractive and unattractive to visitors in terms of purchases).
- For those looking for a powerful tool to track sessions, Inspectlet covers all the bases: clicks, cursor movements and scrolling. The conversion map has a great filtering capability, and the program allows you to tag individual users to track how they behave on repeated visits. And for those sites with a marketing angle, Inspectlet helps with lead generation that can really aid in bringing in more traffic to your site. It’s a little more expensive than other heatmapping programs—about $39 a month to start—but you get 5,000 session recordings for that price.
- Extremely easy to use and understand, Mouseflow offers heatmaps detailing clicks, scrolling, general site movement and navigation and even areas of attention. Like Inspectlet you can record user interaction, and with the form analytics feature you can also determine why certain users are leaving your site before signing up for e-mail newsletters, alerts and the like. Additionally, Mouseflow comes with the ability to create and track custom “funnels,” which show how users from various traffic sources behave while on your site. At $19 month it’s a good value for those just beginning the heatmap journey, and site owners can always increase the number of sessions they record without shelling out too much more money.
• Lastly, for those who don’t know if heat-mapping is right for them and therefore don’t want to pay for any service up front, SeeVolution is a good place to begin. Easy to install, it offers a really nice and sleek dashboard that clearly displays and interprets the information being gathered, and it includes much the same features as paid programs: maps for clicks, scrolling, mouse movements etc. You even get free (but not very comprehensive) analytics data that shows how your site is performing overall.