For the past several years Google Analytics has been the go-to tool for parsing a website’s effectiveness for visitors. With a few clicks a designer or administrator can see numbers of hits and click-throughs, time spent on specific pages, which pages and elements are being ignored and much more.
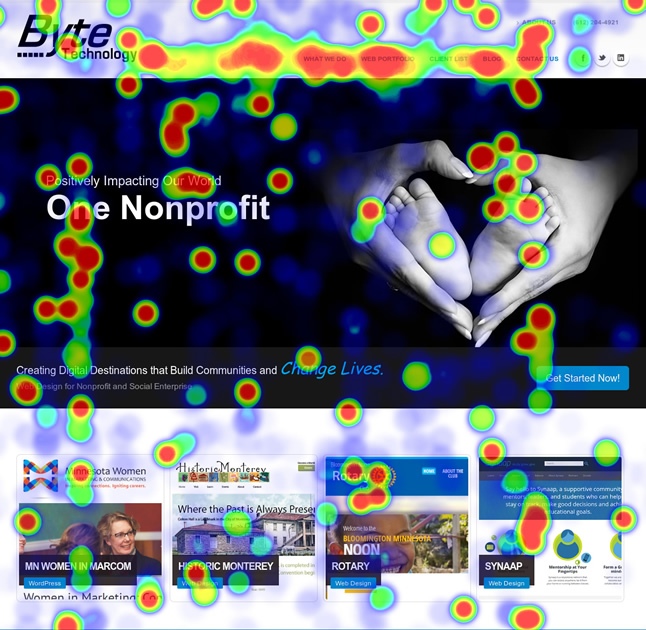
Whereas Analytics still holds immense value to determine what is working and what is not, the truly savvy website developer and owner couples it with heat mapping, complex graphic displays that show what areas of a web page or site are most frequently scanned by visitors and how they’re interacting with different page elements such as video, text links and the like. And with this data in hand, said developers and administrators can easily take the strategic opportunities heat mapping provides to transform their designs, flows and layout for optimal usage.
Heat mapping answers many questions other analytical tools do not: Are your visitors distracted by too many choices? Are they leaving your page before subscribing to an email subscription option? Are you putting enough emphasis on the pages that are most important to users? What images and ads on landing pages are evoking the best responses and generating conversions to sales?
The process of creating a heat map is relatively simple. To begin, choose one or two pages on which to begin the process, such as your homepage, resource page or a page where your best-selling products are offered. Throughout the heat map process you’ll want to eventually check all of them, but experts suggest starting slowly to avoid getting an avalanche of information that is difficult to wade through. And once you choose the page or pages to examine, think about what you want to accomplish with the data gleaned: is your goal to sign up email subscribers, get them to purchase a product, read a series of blog posts or contact you regarding an opportunity? A heat map will show you what people are clicking on and reading, and those are the things you’ll want pump up by making them easier to find and access.
When you’re ready to set up your first heat map, find a tool to download and install: there are lots of free and paid options, and many can be initiated and up and running in just a few minutes. And once your map starts garnering data, keep a close eye on the information it’s reporting before jumping in and making changes to site (web analytics experts recommend that, if your site gets less than 10,000 hits a month, allow the heat map to run for four weeks before transforming your site’s design or layout.)
As the heat map answers questions about your site—such as the number of visitors clicking on your page’s main objective, areas that are receiving the most attention, what sorts of multimedia elements such as video, texts and images are being utilized and so on—you can then take action on a tweaking effort or major overhaul. Some of the most common actions are to remove underperforming or underutilized pages or links that have poor click-through rates; adding more visual elements if the existing ones are getting solid clicks; bulking up the number of subscribe or checkout buttons: making it easier for visitors to find product information; or even just moving “hotspots”—the things getting the most attention and use—to a more prominent point within your site map.
By taking advantage of what heat maps can tell you about your supporter or consumer base you can leverage the power of your site and, in the end, guide visitors to the areas you want them to see the most and, in the end, to take the actions that best benefit your ultimate goals.